

When problems repeat, frustration rises. Teams fix issues again and again, yet nothing really changes. The diagrama de ishikawa offers a calm, structured way to break this cycle and find what is truly going wrong. 🧠
This visual “fishbone” approach helps people move beyond blame and guesswork. It guides teams toward clear causes, practical solutions, and long‑lasting improvements in quality and efficiency.
What Is the Ishikawa Diagram?
The Ishikawa Diagram, also known as the fishbone diagram or cause-and-effect diagram, was developed in the 1940s. Its creator, Kaoru Ishikawa, was a pioneer in quality management and industrial engineering in Japan.
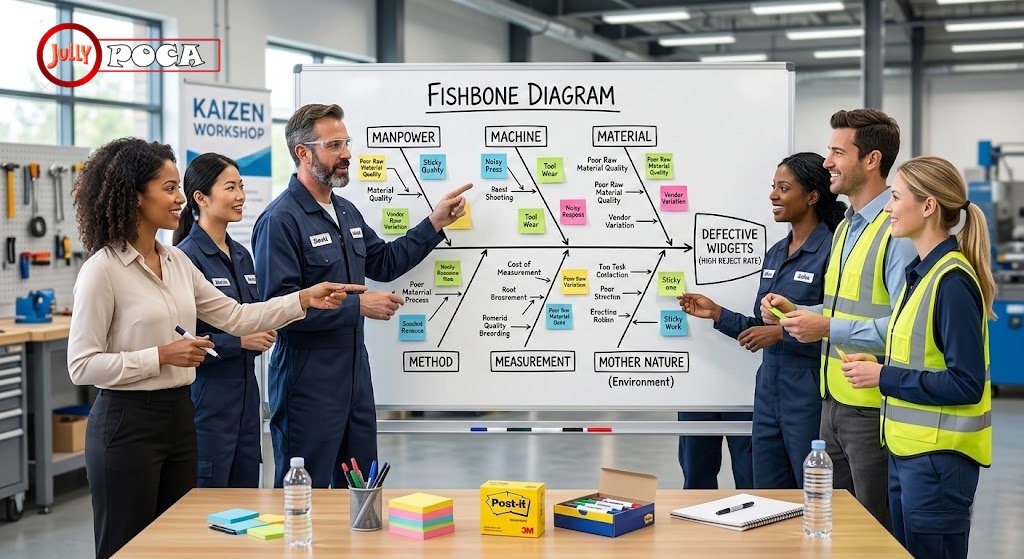
The diagram looks like a fish:
- The head shows the problem or effect.
- The bones show main categories of causes.
- The smaller bones show detailed sub‑causes.
It is one of the seven basic quality tools and is widely used in:
- Lean manufacturing
- Kaizen
- Six Sigma
- Total Quality Management (TQM)
By organizing possible causes in a single visual, the diagram helps teams see complex problems in a simple, shared way.
The 6M Framework for Root Cause Analysis
A common way to structure the fishbone is the 6Ms. These categories help ensure that analysis is complete and systematic.
| 6M Category | What It Covers | Example Causes |
|---|---|---|
| Manpower | People, skills, behaviors, communication | Lack of training, unclear roles, fatigue, low engagement |
| Methods | Processes, procedures, workflows | No standard process, unclear steps, missing checklists |
| Materials | Raw materials, components, consumables | Poor supplier quality, wrong specification, storage issues |
| Machines | Equipment, tools, technology | Breakdowns, outdated machines, poor maintenance |
| Environment | Physical and external conditions | Temperature, noise, humidity, cluttered workspace |
| Measurement | Data, instruments, metrics, controls | Wrong calibration, missing data, inconsistent measurement |
Using the 6Ms, the fishbone becomes a map of potential root causes. Teams can then explore each branch and decide where to act first.
1. Clarifies the Problem So Everyone Sees the Same Goal 🎯
Many improvement projects fail because people do not agree on the problem. Some focus on delays, others on quality, others on cost. The fishbone diagram starts by defining the effect very clearly.
Typical problem statements include:
- “High defect rate in product X in the last three months.”
- “Frequent unplanned downtime on machine Y.”
- “Customers waiting more than 10 minutes on the hotline.”
This clear “head of the fish”:
- Aligns everyone on the same target.
- Prevents the team from chasing unrelated topics.
- Makes it easier to measure whether the solution worked.
Example:
A service center simply wrote “Poor service” as a problem. The team struggled to agree. After refining it to “Customer complaints about long waiting time in the phone queue,” discussion became precise and focused.
2. Turns Brainstorming into a Structured, Calm Conversation
Brainstorming can easily become noisy and unfocused. People jump between ideas and opinions. The cause-and-effect diagram offers a gentle structure that keeps creativity while avoiding chaos.
During a session, the facilitator:
- Draws the main backbone and problem head.
- Adds the 6M categories as main branches.
- Asks the team to suggest causes under each branch.
- Captures causes as short phrases along the bones.
This structure:
- Keeps discussion organized by category.
- Ensures quiet voices are heard, not just the loudest.
- Prevents the group from blaming individuals.
- Captures ideas visually, which reduces misunderstanding.
Helpful prompts during brainstorming include:
- “What in our methods might contribute to this?”
- “Which machines could be involved?”
- “Are there any environment conditions we are ignoring?”
Short example:
In a hospital, nurses, doctors, and administrators used a fishbone to discuss medication errors. Because ideas were organized by category, people felt safer to speak. The team saw the process, not individuals, as the starting point for change. 💬
3. Encourages Collaboration Across Departments
Problems in quality and efficiency rarely belong to one team alone. They cross boundaries: sales, operations, maintenance, IT, and more. The Ishikawa approach invites all stakeholders to the same diagram.
Benefits of this cross‑functional view:
- Each group brings unique insights about causes.
- Misunderstandings between departments reduce.
- People see how their work affects others upstream and downstream.
- Ownership of the final solution is shared, not forced.
To strengthen collaboration:
- Invite people from different roles and shifts.
- Include both frontline staff and supervisors.
- Use simple language on the diagram.
Example:
In a factory facing late deliveries, logistics blamed production. Production blamed purchasing. With a fishbone session, they discovered missing material forecasts and unclear priorities. Improvements were then defined together, not imposed.
4. Reveals True Root Causes, Not Just Symptoms 🕵️♀️
Teams often react to symptoms:
- “Increase inspection.”
- “Work faster.”
- “Add one more person.”
These actions can temporarily help, yet they rarely fix the deeper issue. The fishbone diagram helps teams look below the surface.
A useful companion tool here is the 5 Whys technique:
- Start with a listed cause on a fishbone branch.
- Ask “Why does this happen?” and write the answer.
- Repeat up to five times, or until you reach a root cause.
- Check if the root cause is within your control.
For example:
- Effect: High scrap rate on a machine.
- Cause on fishbone: “Operator set‑up errors.”
- Why? Training incomplete.
- Why? No standard training plan for new hires.
- Why? No defined process owner for training.
Now the root cause is about training design and ownership, not only about individuals. The solution can therefore be systemic, such as:
- Creating a standard training plan.
- Defining clear process ownership.
- Updating work instructions with photos and checklists.
This is how the diagrama de ishikawa helps people move from blame to learning and true prevention.
5. Prevents Recurring Issues and Costly Rework
When root causes stay hidden, the same problems return:
- The same machine breaks again.
- The same complaint appears in surveys.
- The same defect shows on the audit report.
Repeated failures create:
- Higher costs due to rework and scrap.
- Delays in deliveries and projects.
- Frustration and burnout in teams.
- Damage to customer trust.
By identifying systemic causes (for example, lack of standards, missing maintenance, unclear roles), the fishbone approach supports long‑term fixes. These often include:
- Standard operating procedures with visual guides.
- Preventive maintenance plans.
- Clear communication flows and hand‑offs.
- Improved supplier agreements and checks.
Example:
In a packaging line, boxes kept collapsing in transport. A fishbone diagram showed that both materials (weaker cardboard) and methods (new stacking pattern) had changed. By adjusting both, complaints dropped sharply and rework nearly vanished. 📦
6. Supports Continuous Improvement and Kaizen Culture
Organizations that thrive treat problems as information, not as shame. The fishbone diagram fits perfectly into Kaizen and continuous improvement cultures.
It encourages teams to:
- Observe problems calmly and factually.
- Go to the Gemba (where the work happens).
- Ask questions before jumping to answers.
- Test small improvements, then standardize what works.
In many Kaizen events, the fishbone is used during the cause‑identification phase. Teams then design countermeasures using:
- Simple visual controls.
- Error‑proofing ideas (Poka‑Yoke).
- Short experiments to confirm impact.
The American Society for Quality offers a helpful overview of this type of root cause tool.
Over time, this way of working builds a culture where:
- People speak up about issues.
- Leaders welcome transparent data.
- Improvement is part of daily work, not a one‑time project.
7. Integrates Easily with Other Quality Tools 🔗
The fishbone diagram does not stand alone. It works smoothly with other methods in Lean, Six Sigma, and TQM.
Common combinations include:
- Fishbone + 5 Whys
To go deeper on each major cause. - Fishbone + Pareto Analysis (80/20 Rule)
To focus attention on the most frequent or costly causes. - Fishbone + Control Charts
To link causes with changes in process variation. - Fishbone + FMEA (Failure Modes and Effects Analysis)
To anticipate potential failures before they occur.
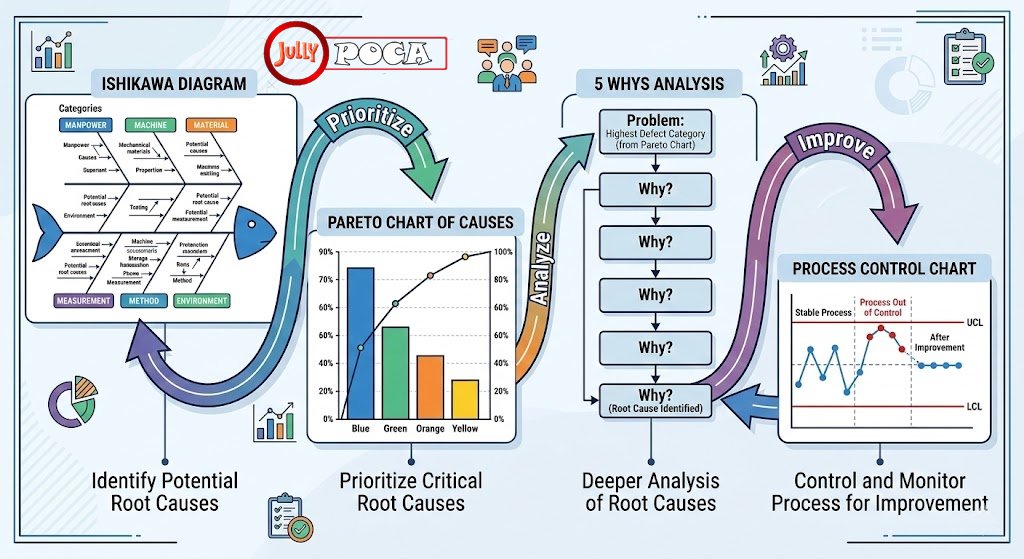
A structured improvement project may follow this path:
- Define the problem using data.
- Map the process.
- Use a fishbone to list causes.
- Use Pareto analysis to prioritize.
- Apply 5 Whys to top causes.
- Design and test countermeasures.
- Standardize and monitor results.
Detailed examples of these combinations appear in many quality management resources, for instance on Lean Six Sigma platforms according to topic.
This integration makes the fishbone a flexible tool for different levels of complexity, from frontline problem solving to advanced Six Sigma projects.
8. Improves Communication with Management and Customers
Leaders need clarity. They must understand:
- What is going wrong.
- Why it is happening.
- What you propose to do.
The fishbone diagram gives a concise visual story:
- It shows that the team studied the problem broadly.
- It highlights key causes and how they relate.
- It demonstrates a methodical approach, not random guesses.
This builds confidence when you present improvement plans.
For customers, the fishbone can:
- Support root cause reports for major incidents.
- Show that your organization takes quality seriously.
- Demonstrate respect for their time and trust.
Short example:
A software company used a fishbone in a post‑incident report for a large client. They showed causes across people, process, tools, and environment. The client appreciated the transparency and continued the partnership. 🤝
9. Works in Any Industry or Function
The Ishikawa Diagram is not limited to factories. Its logic applies to any recurring problem where causes are complex.
Examples across sectors:
- Manufacturing:
Defects, machine failures, safety incidents, inventory errors. - Healthcare:
Delays in treatment, medication errors, readmission rates. - Services and Call Centers:
Long waiting times, billing errors, inconsistent responses. - IT and Software:
System outages, deployment failures, performance issues. - Logistics and Supply Chain:
Late deliveries, damaged goods, lost shipments.
In each case, the main categories may be adjusted, yet the core idea is the same:
Define the effect, explore causes visually, and agree on targeted actions.
Because the diagram is simple to understand, it can also support training programs for new employees and frontline leaders.
10. Strengthens Data‑Driven Decision Making 📊
Many teams feel overwhelmed by data. Others have little data and rely on opinions. The Ishikawa Diagram helps connect facts with causes in a balanced way.
Ways it supports data‑driven work:
- Forces you to define the problem with numbers
(defect rate, delay time, cost, frequency). - Encourages you to validate causes with evidence
(checklists, measurements, observations at the Gemba). - Links well with Measurement System Analysis and calibration checks.
Within the 6Ms, the Measurement branch is often neglected. When explored, teams may find:
- Instruments are not calibrated.
- Data is captured irregularly.
- Different teams use different definitions for the same metric.
By strengthening the measurement system, decisions become clearer. Solutions are then evaluated with before‑and‑after data, not just feelings.
Example:
A lab thought they had a process problem. The fishbone revealed that inconsistencies came from different thermometers showing different temperatures. After calibration and standardization, results stabilized and internal disputes reduced.
How to Create an Ishikawa Diagram Step by Step
If you want to apply the diagrama de ishikawa with your team, you can follow this simple process.
1. Define the Problem Clearly
- Use a specific, measurable statement.
- Include where, when, and how often it occurs.
- Write it at the head of the fish.
Example:
“5% of invoices have errors in customer address fields in the last quarter.”
2. Draw the Backbone and Main Branches
- Draw a horizontal line from left to right.
- Add a box or circle at the right for the problem.
- Draw main branches for the 6Ms or other chosen categories.
If the 6Ms do not fit your context, you can adapt, for example:
- Policies
- People
- Process
- Technology
- Environment
3. Brainstorm Possible Causes
- Involve a multidisciplinary team.
- Go to the Gemba if possible and observe the process.
- Encourage open sharing, without judgment.
- Use sticky notes so causes can be moved and grouped.
Prompts to keep the flow:
- “What could be causing this in our methods?”
- “Are any materials different lately?”
- “What in our environment might affect this?”
4. Explore Sub‑Causes
- For each cause, ask “Why does this happen?”
- Add sub‑branches for each deeper reason.
- Combine this with the 5 Whys to reach root causes.
Keep asking until:
- The cause is specific enough to act on.
- The cause is within your control to change.
- The team agrees it is realistic and relevant.
5. Analyze and Prioritize
After brainstorming, you will have many potential causes. To focus:
- Group similar causes together.
- Ask the team to vote on the most likely or impactful ones.
- Use Pareto analysis if you have frequency or cost data.
You may place a star or highlight near top priority causes on the diagram.
6. Validate with Data and Experience
Before jumping to solutions:
- Collect data where possible.
- Observe the process again, with the diagram in mind.
- Check with operators, technicians, or customers who know the work.
This validation step increases the credibility of your diagnosis.
7. Plan and Implement Solutions
Finally, turn insights into action:
- Define countermeasures for each key root cause.
- Assign owners and deadlines.
- Plan small experiments before full rollout.
- Update standards and training after confirming results.
Over time, keep the fishbone diagram as a living document. You can revise it whenever new information appears.
FAQs About the Ishikawa Diagram
1. When should I use the diagrama de ishikawa?
Use it whenever you face a recurring problem or a complex issue with many possible causes. It is ideal when you want cross‑functional input and need more than quick fixes.
2. How long does a typical fishbone session take?
A focused session often takes 60–90 minutes. More complex issues may need several meetings to complete analysis and validation.
3. Do I always have to use the 6Ms?
No. The 6Ms are a helpful starting point, especially in manufacturing. In services or IT, you can adapt branches to better match your reality, such as People, Process, Technology, Policies, and Environment.
4. Can I build the diagram digitally?
Yes. Many teams start on a physical whiteboard for interaction, then move the result to digital tools for sharing. Online whiteboards or diagram tools work well for remote teams.
5. Is the fishbone only for large problems?
Not at all. It can help with both major incidents and smaller, everyday issues. Even a short 20‑minute fishbone discussion can bring new insights and shared understanding.
Conclusion: Make Problems the Starting Point for Lasting Improvement ✅
Modern organizations cannot afford to treat only the surface of problems. They need clear, shared, and practical ways to understand why issues happen and how to prevent them.
Used with care and respect, the diagrama de ishikawa:
- Clarifies complex problems.
- Encourages open collaboration.
- Reveals root causes instead of symptoms.
- Prevents recurring issues and rework.
- Connects smoothly with other quality tools and methods.
You can start small:
- Choose one recurring problem.
- Invite a few colleagues.
- Draw your first fishbone.
- Explore causes calmly and honestly.
- Test one or two improvements and learn from them.
Step by step, this simple diagram can help your organization build a stronger culture of quality, efficiency, and continuous improvement. 🌱

1 Comment
Pingback: Ziikazhel Tompuriz: 7 Powerful Ways to Unlock Positive Creativity & Transformation